Industry Delivery Dashboard | Enterprise Software, DXC Technology
Project Summary: Designed a business intelligence operational dashboard that allowed the Global Leadership Team to make informed business decisions.
My Role: Research / UX / Visual Design / Interaction Design / Strategy / Branding / Prototyping / Testing

Software Engineer X2 Front-end Developer x1 Scrum Master x1
Account Executives, Account Executive Assistants, and Delivery Managers
Enterprise Software - Web Responsive App
Dev Tools - PowerApps, PowerBI, Microsoft Azure
3 Months
Challenge
The Global Leadership team needed a faster, more consolidated way to view and analyze reports to assess the state of the business
Business Goals
For users to have a faster way to make informed business decisions
For users to have a faster way to identify ROI problem areas
Stakeholders
Global Leadership Team, Account Executives, Product Managers DTC Director, UX Design Manager
100%
Improved decision-making process
55%
Increase in user retention
150%
User delight and satisfaction


Process
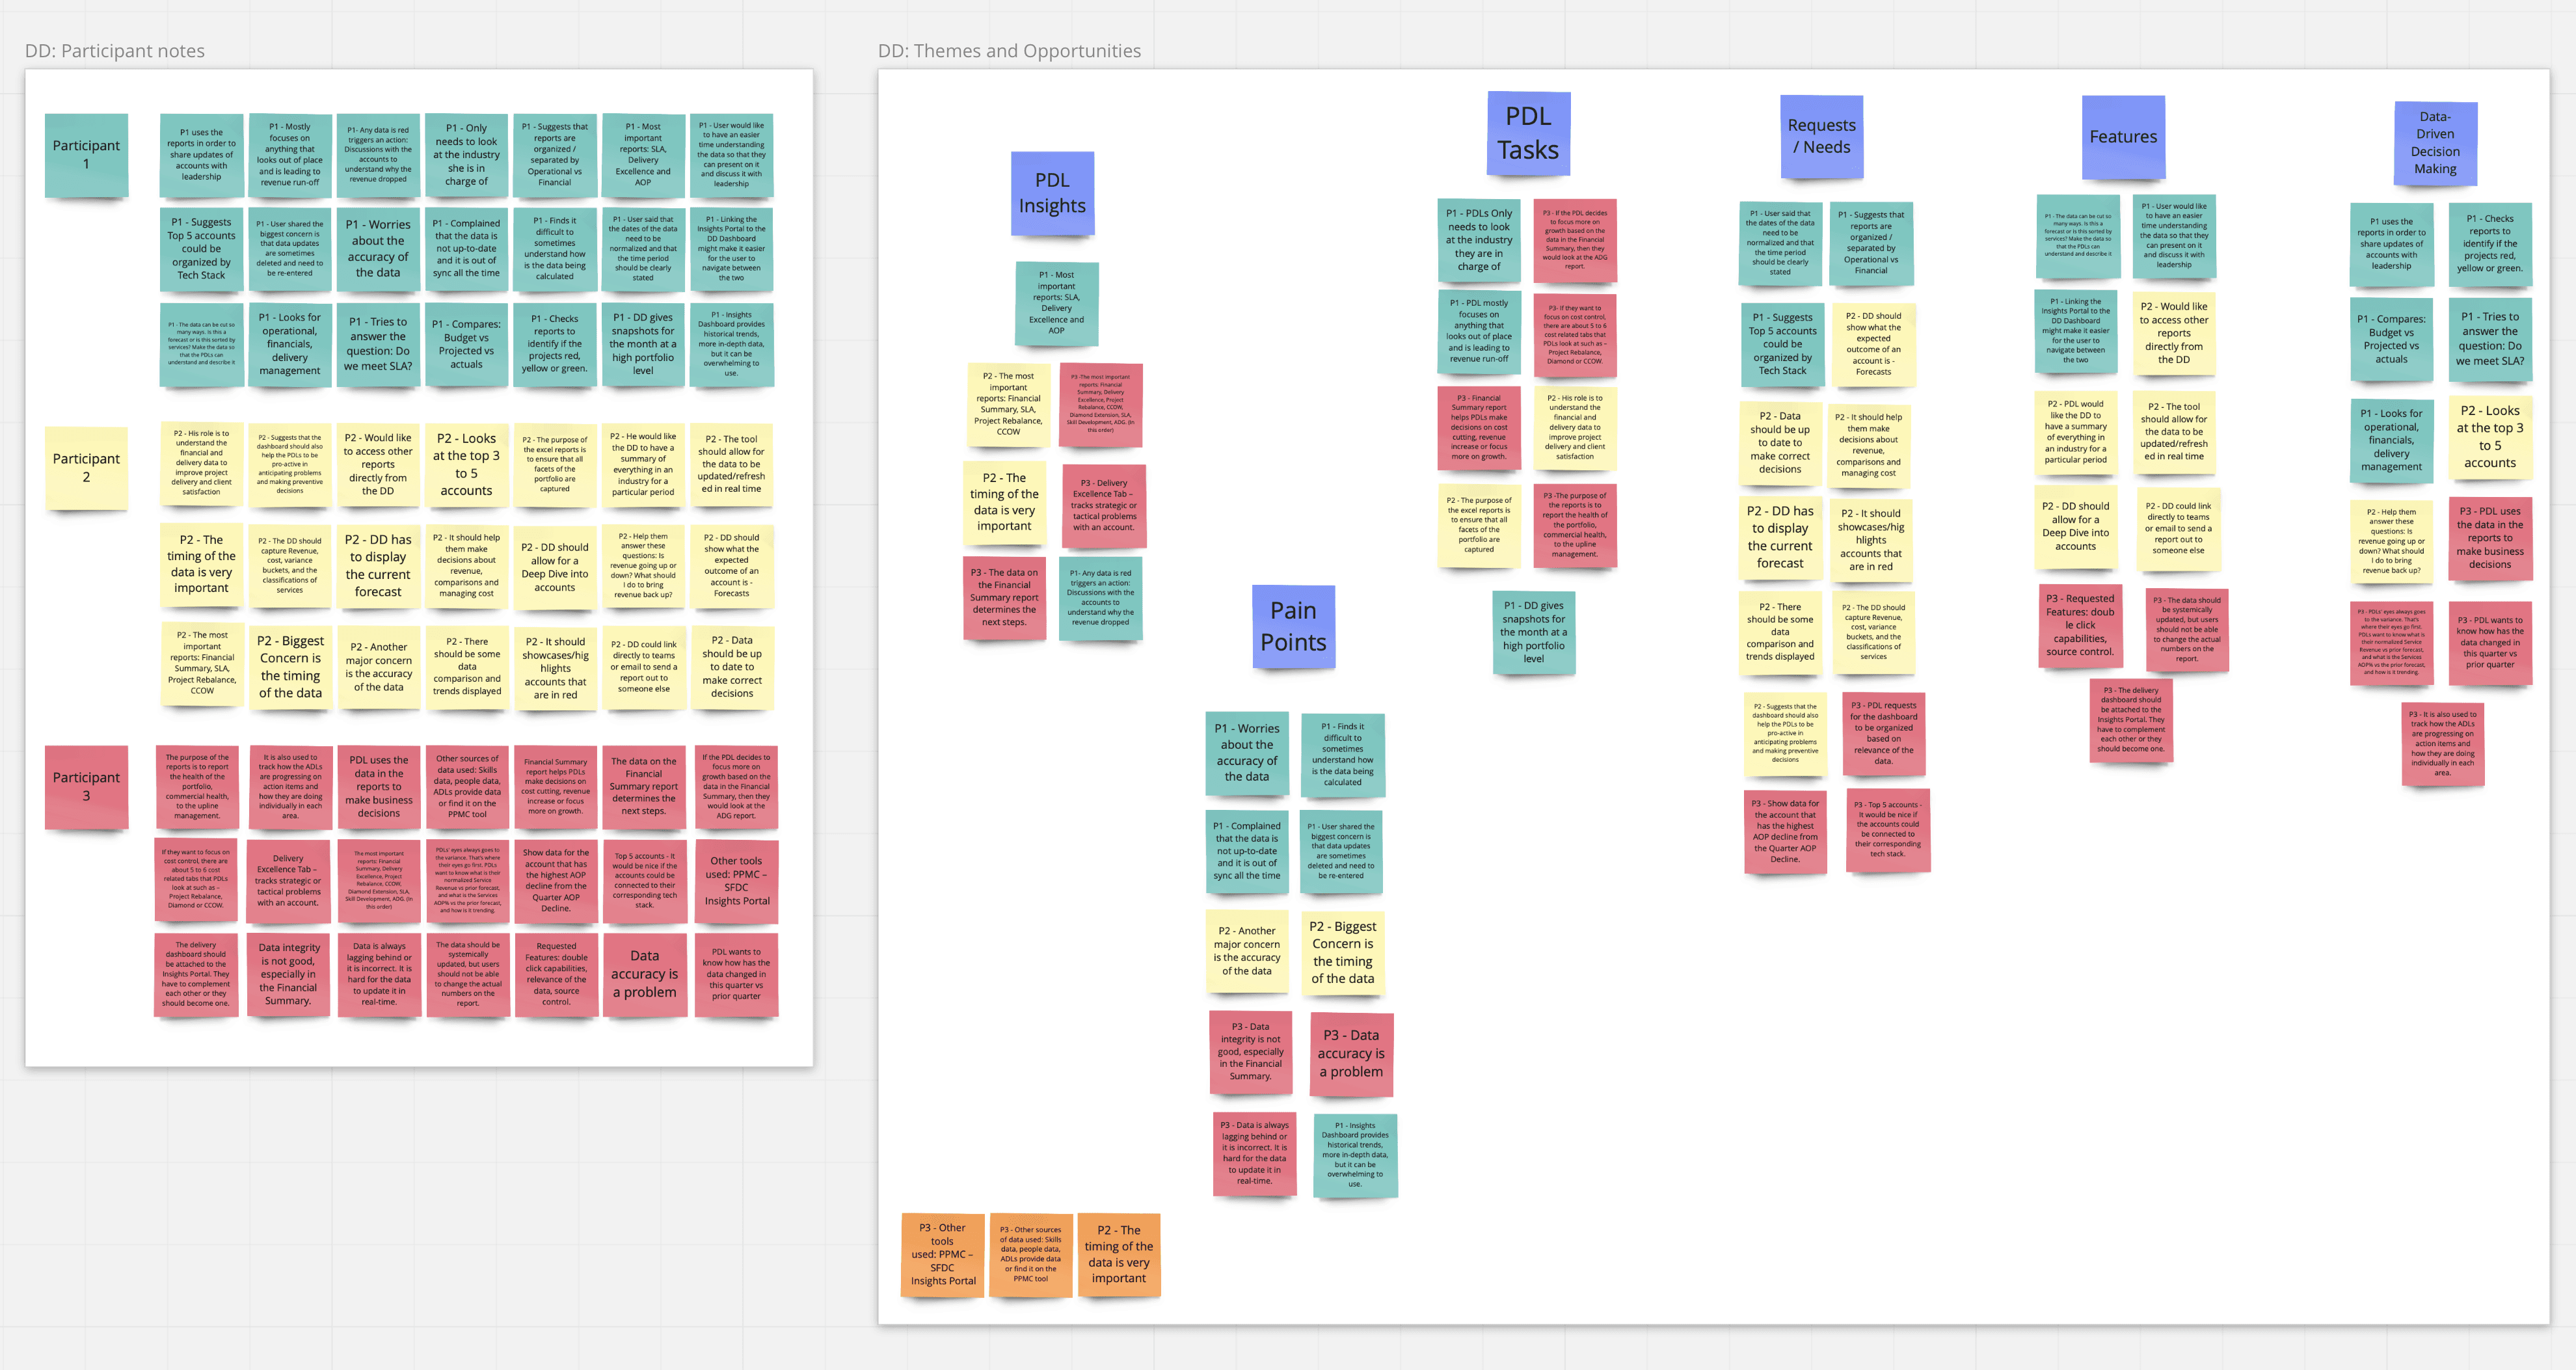
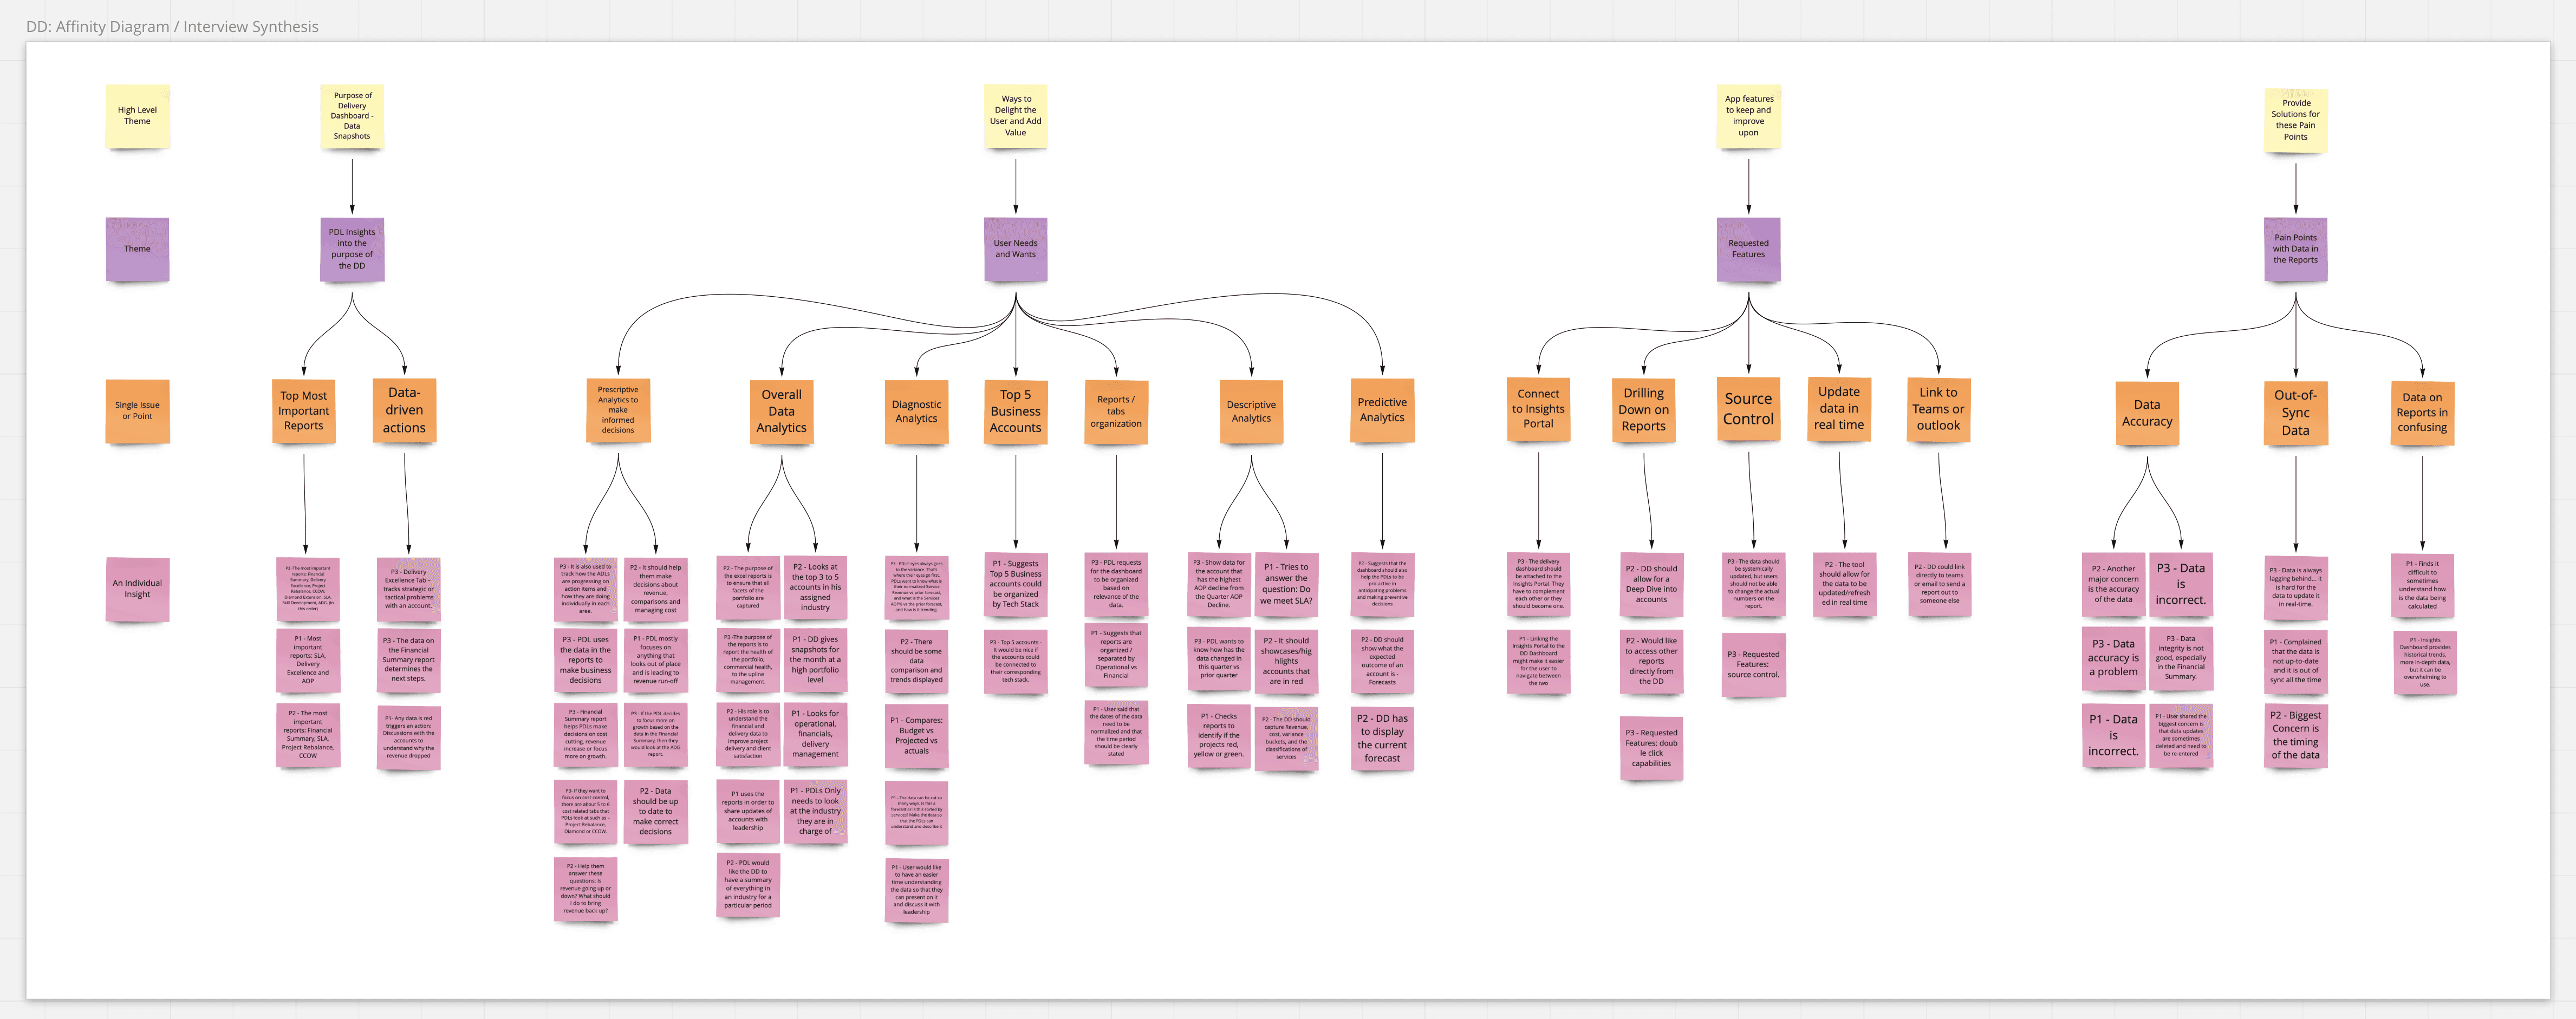
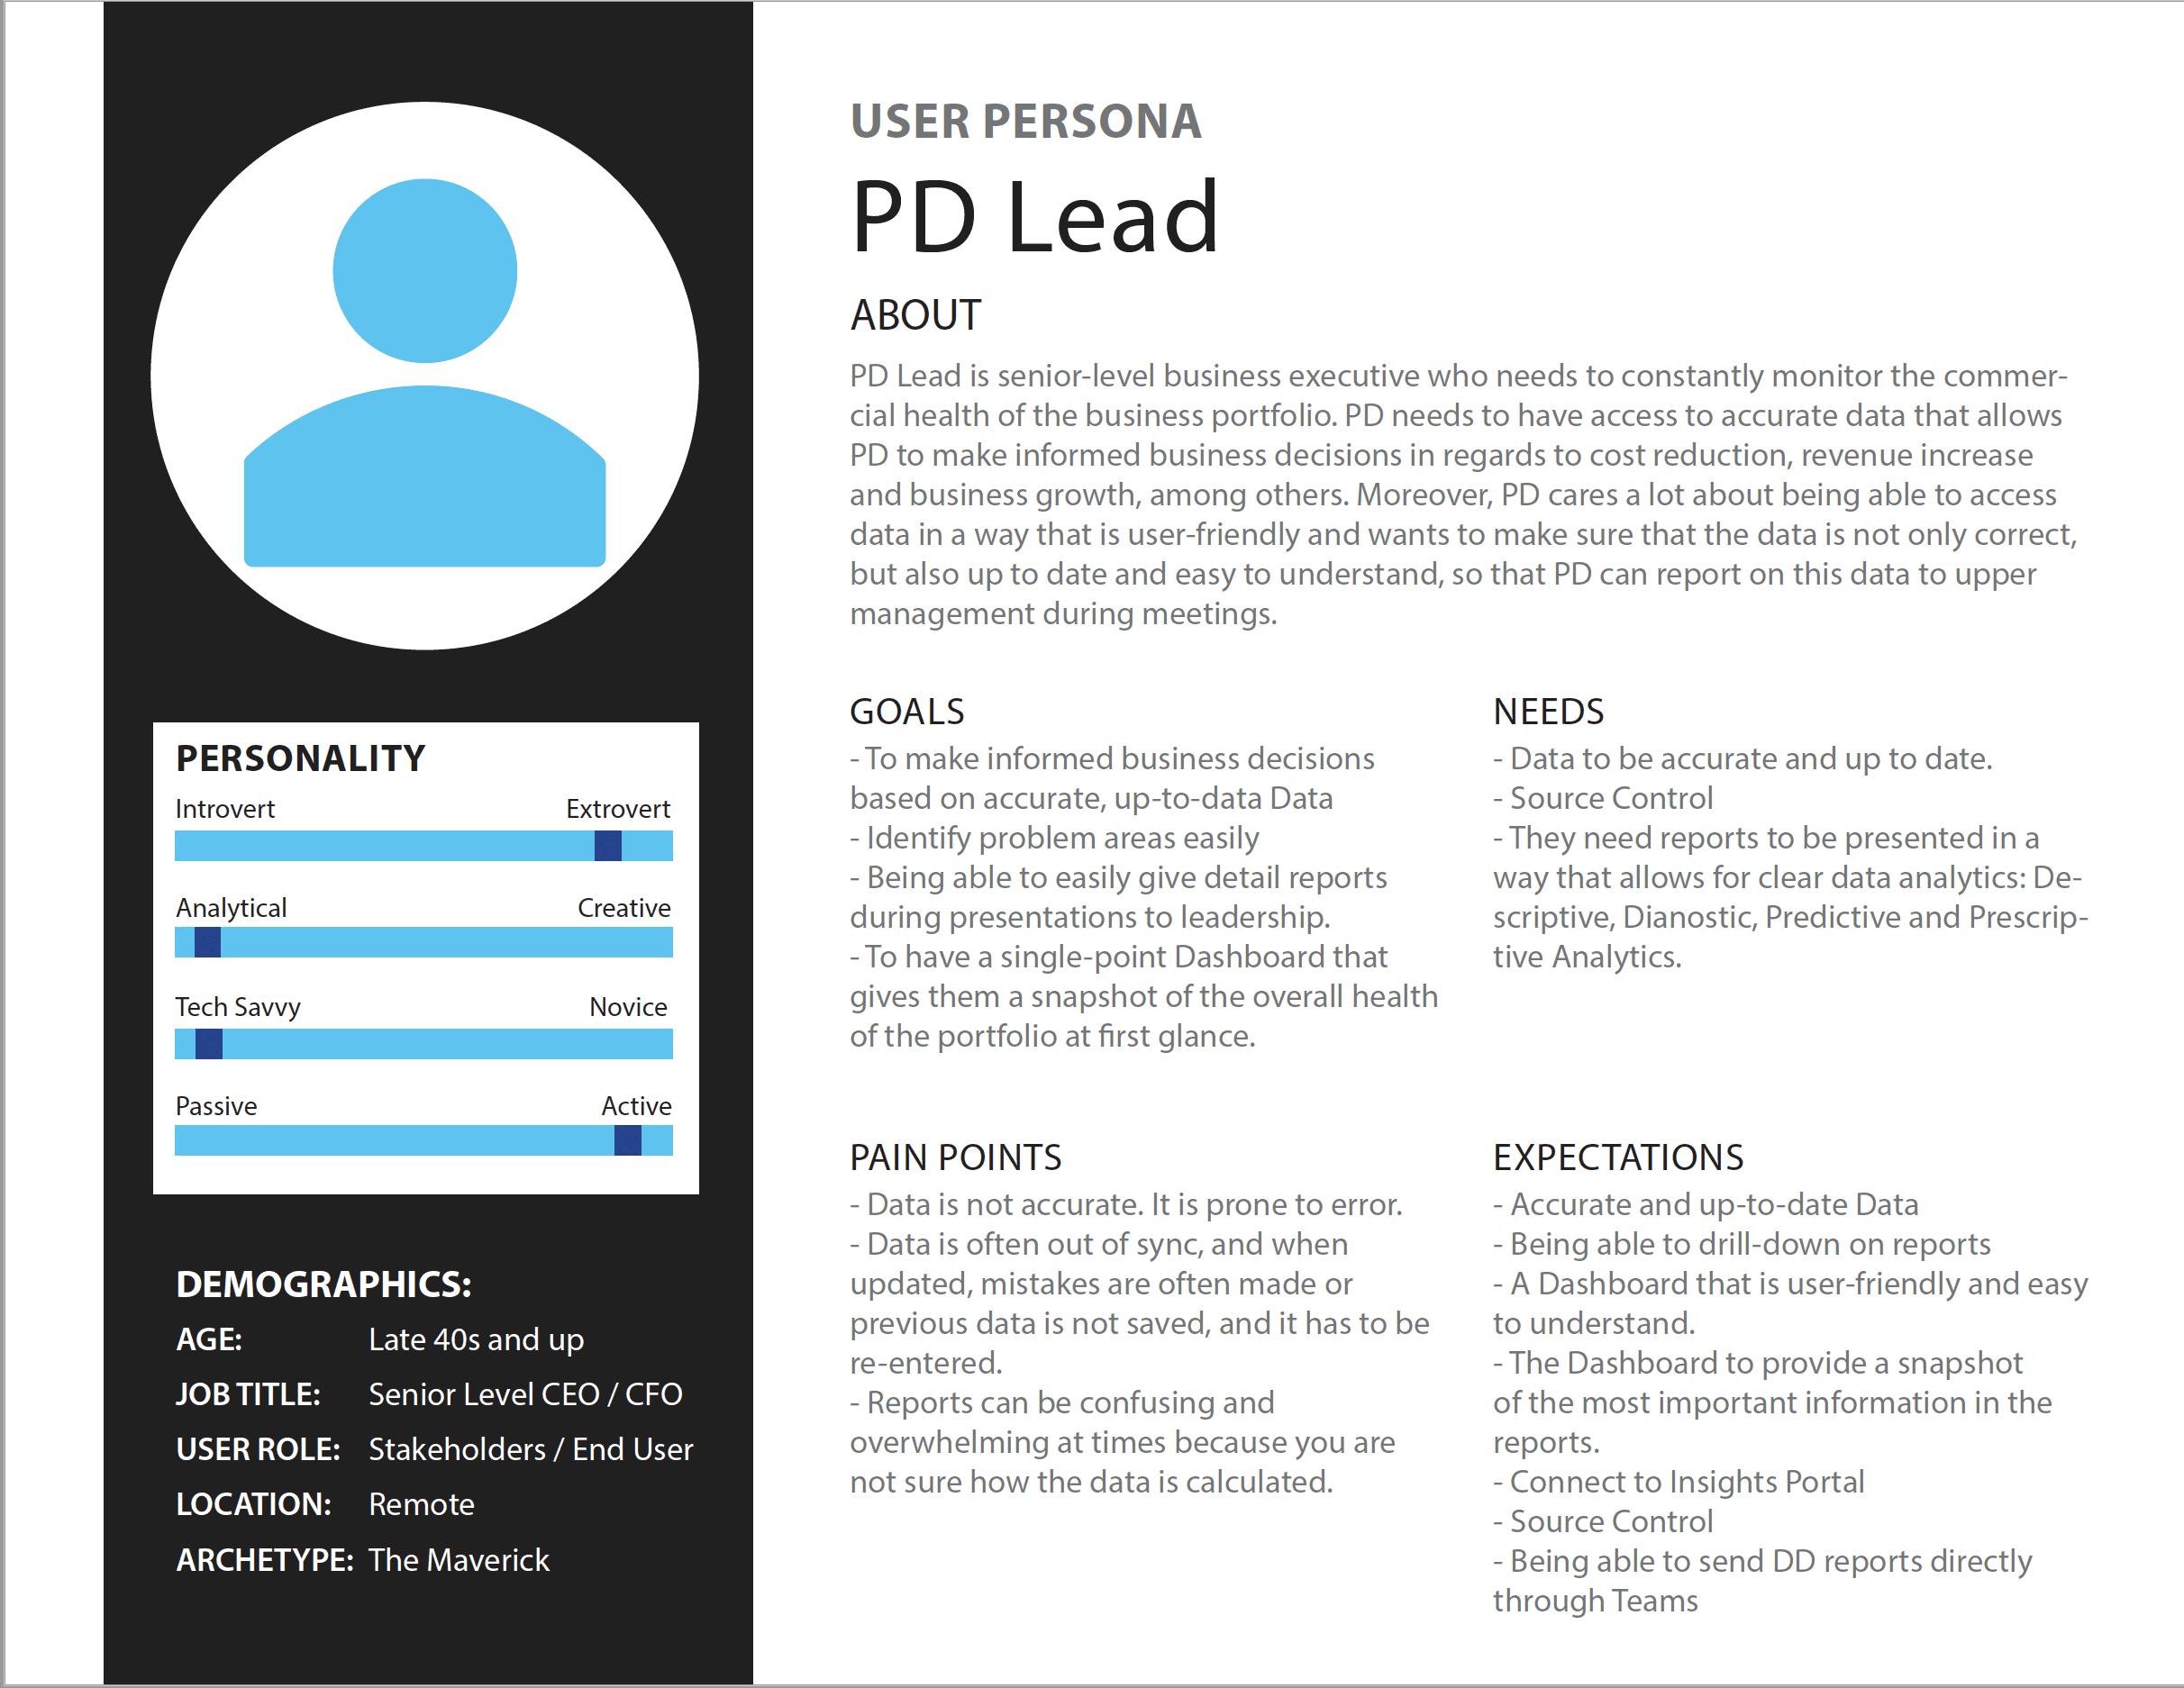
Research & Analysis: Since the feedback collected initially came directly from the end-users, we started by talking to them through one-on-one interviews in order to ensure all pain points, needs and wants were accurately captured.
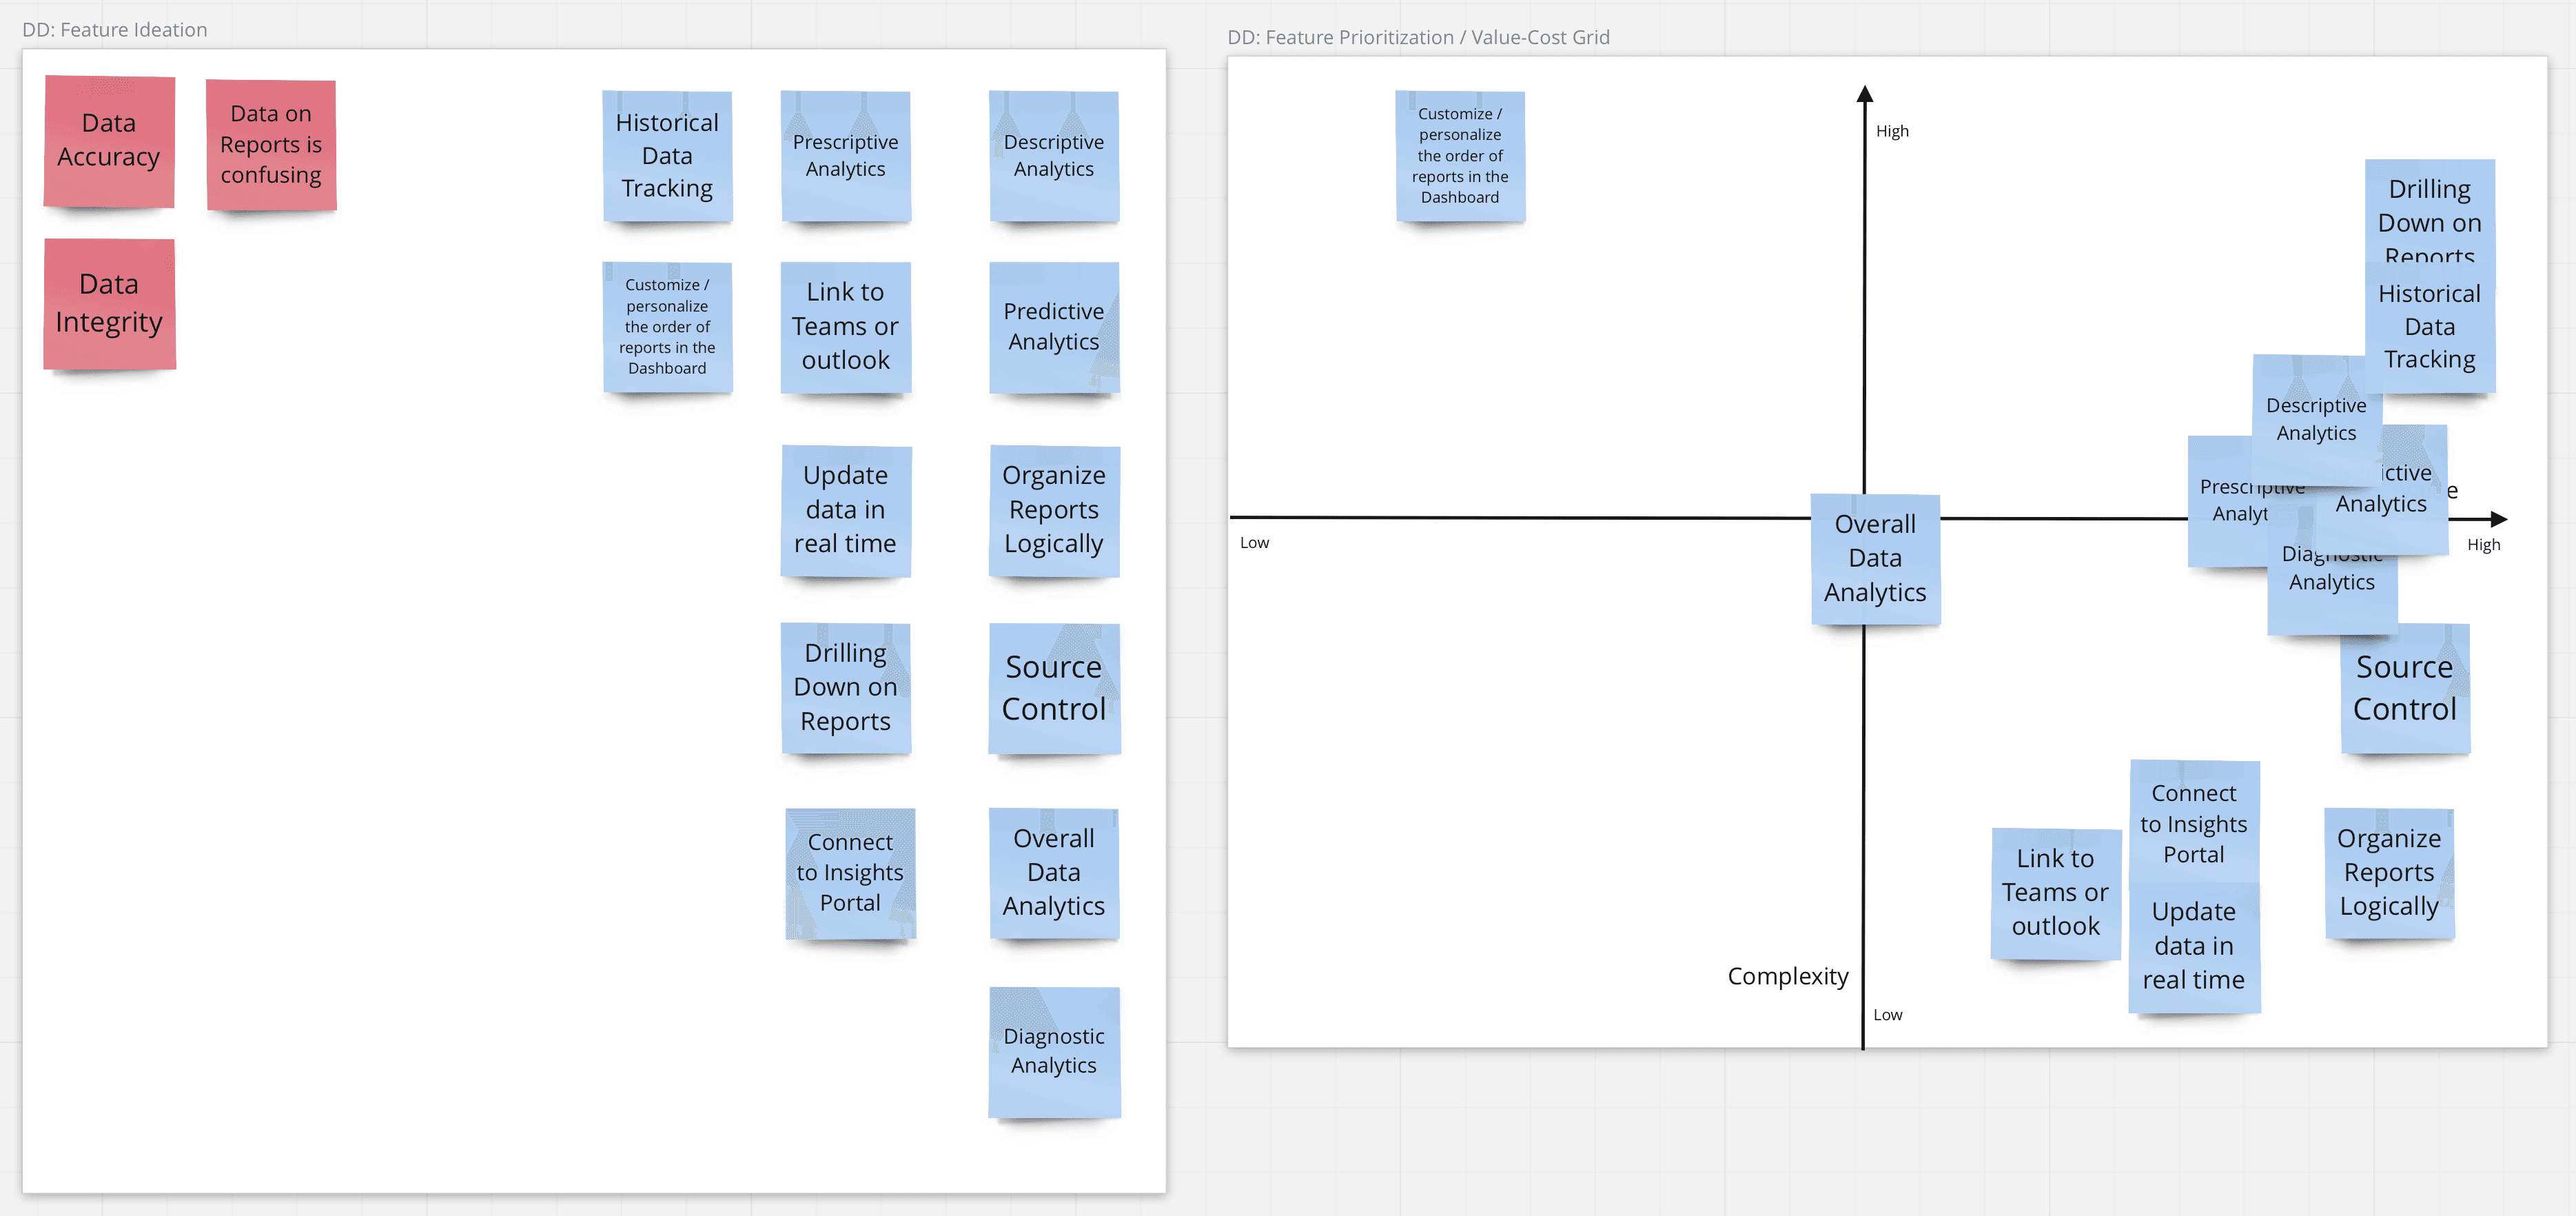
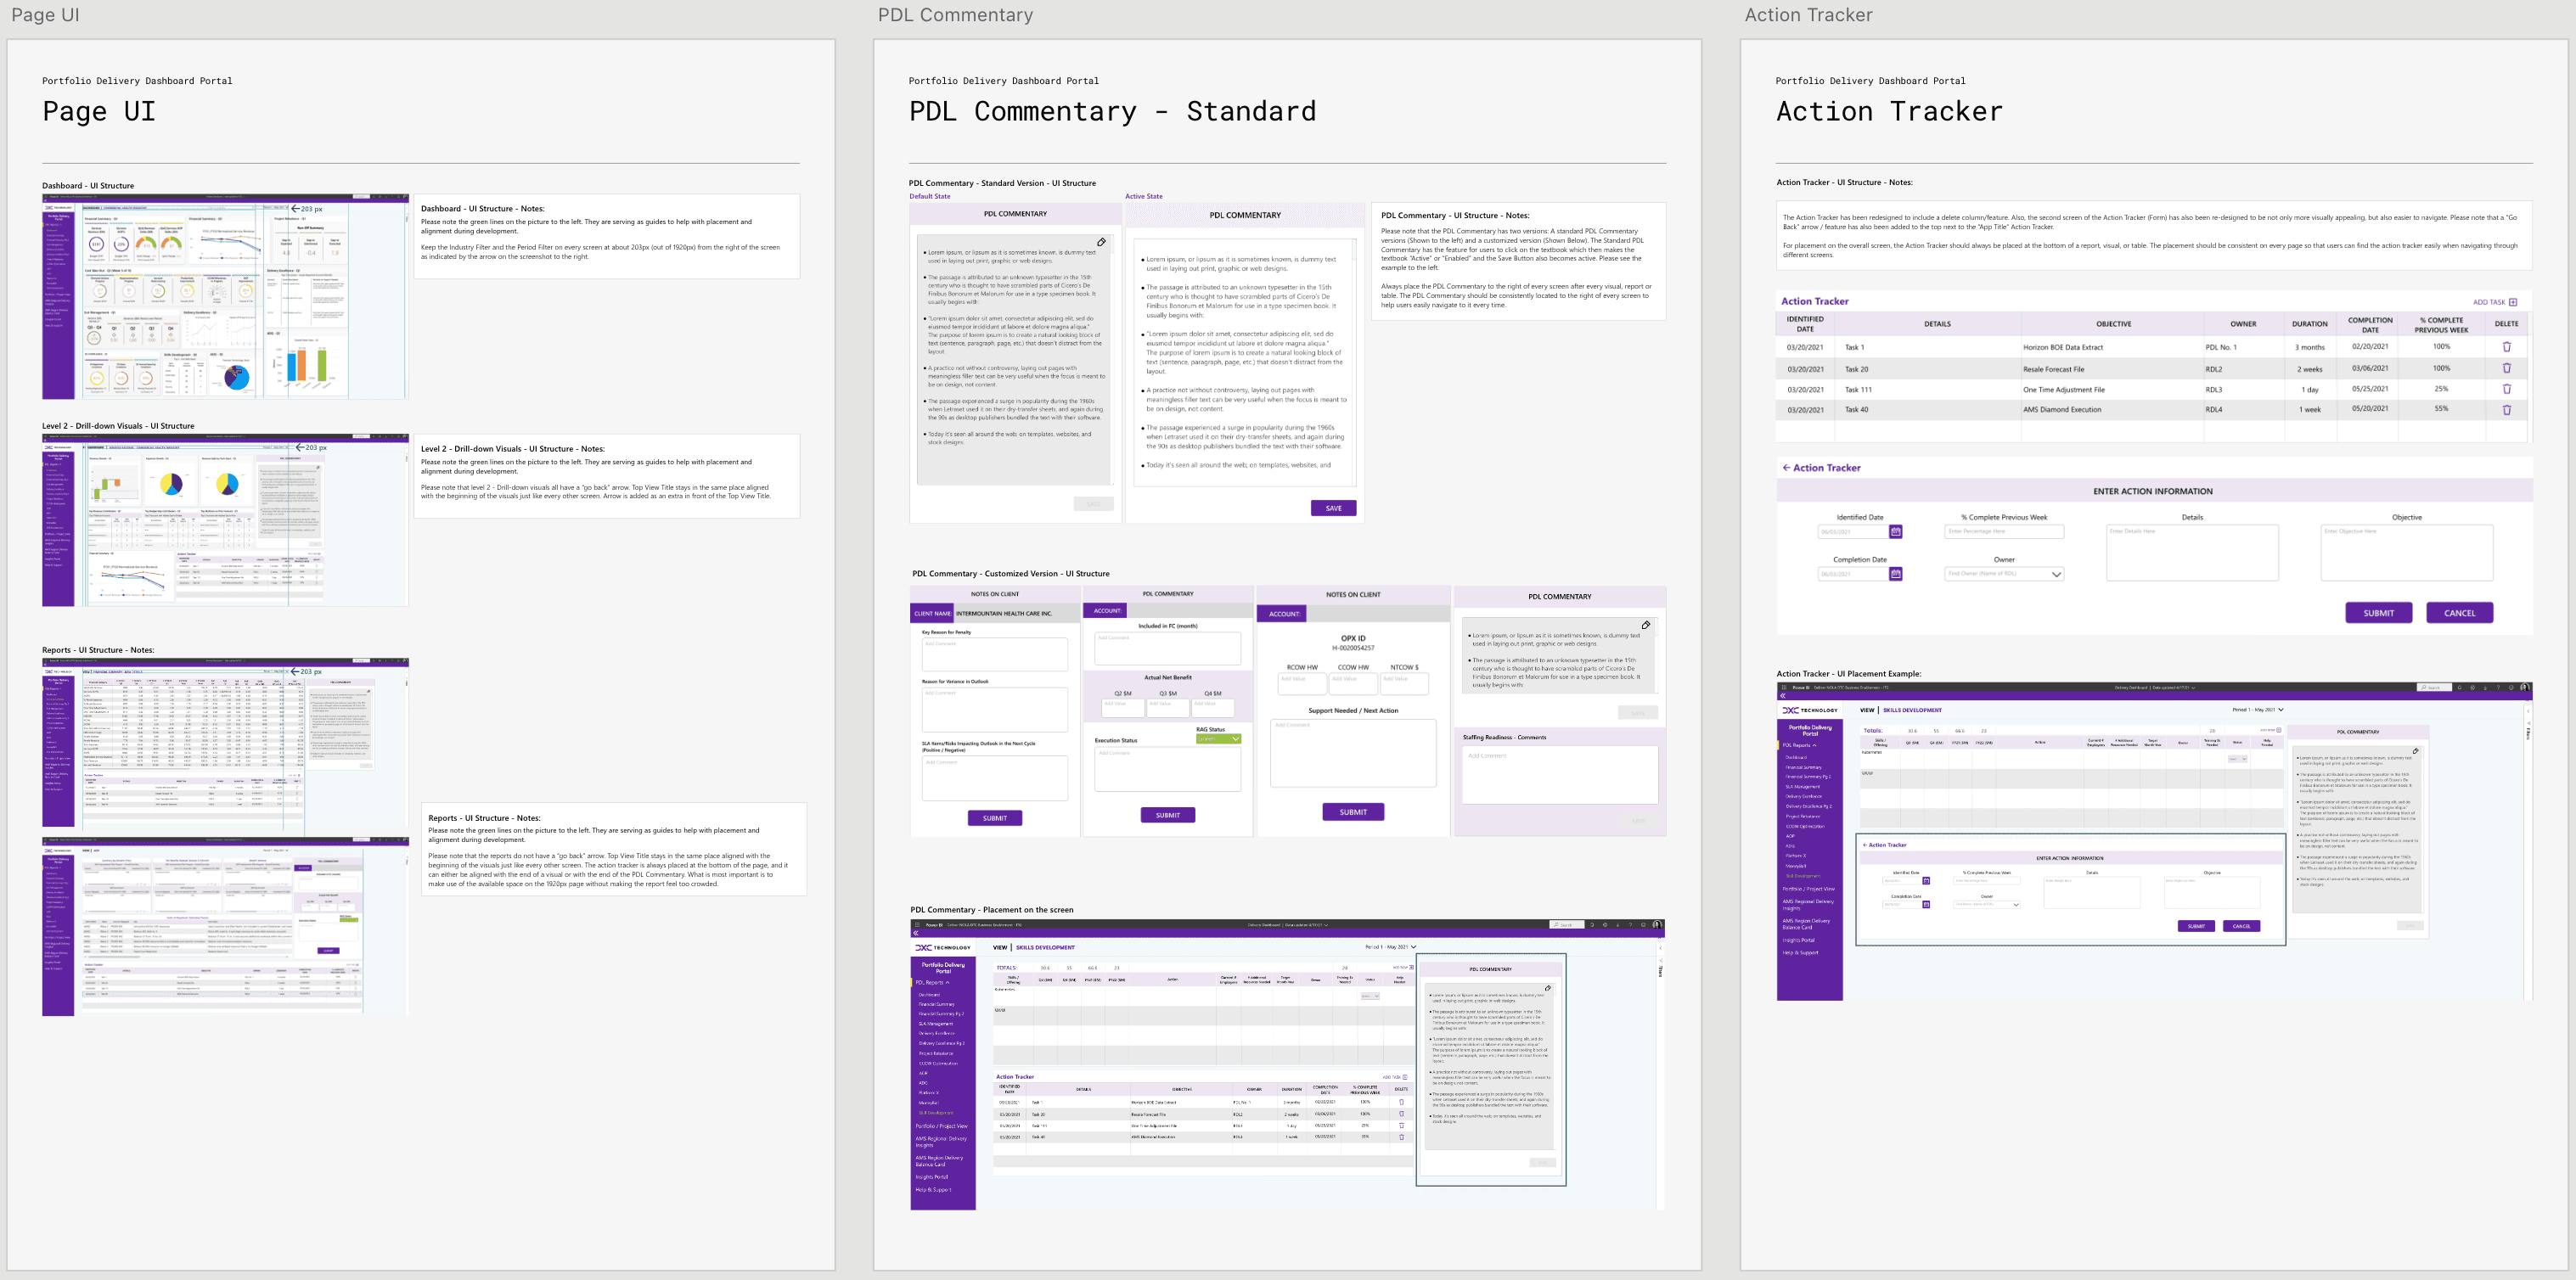
Wireframing & Prototyping: By employing a UCD approach, we were able to work closely with the end users and engage them into providing real-time feedback often, which allowed for quick iteration.
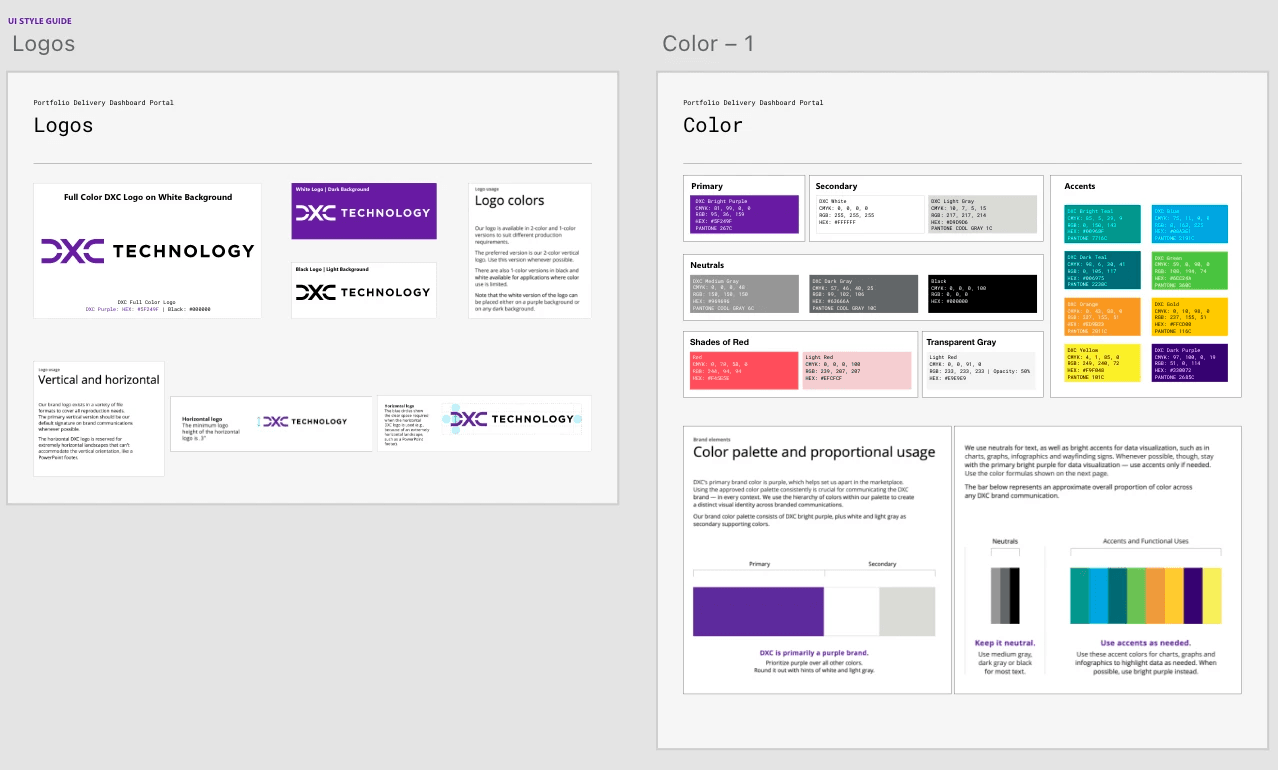
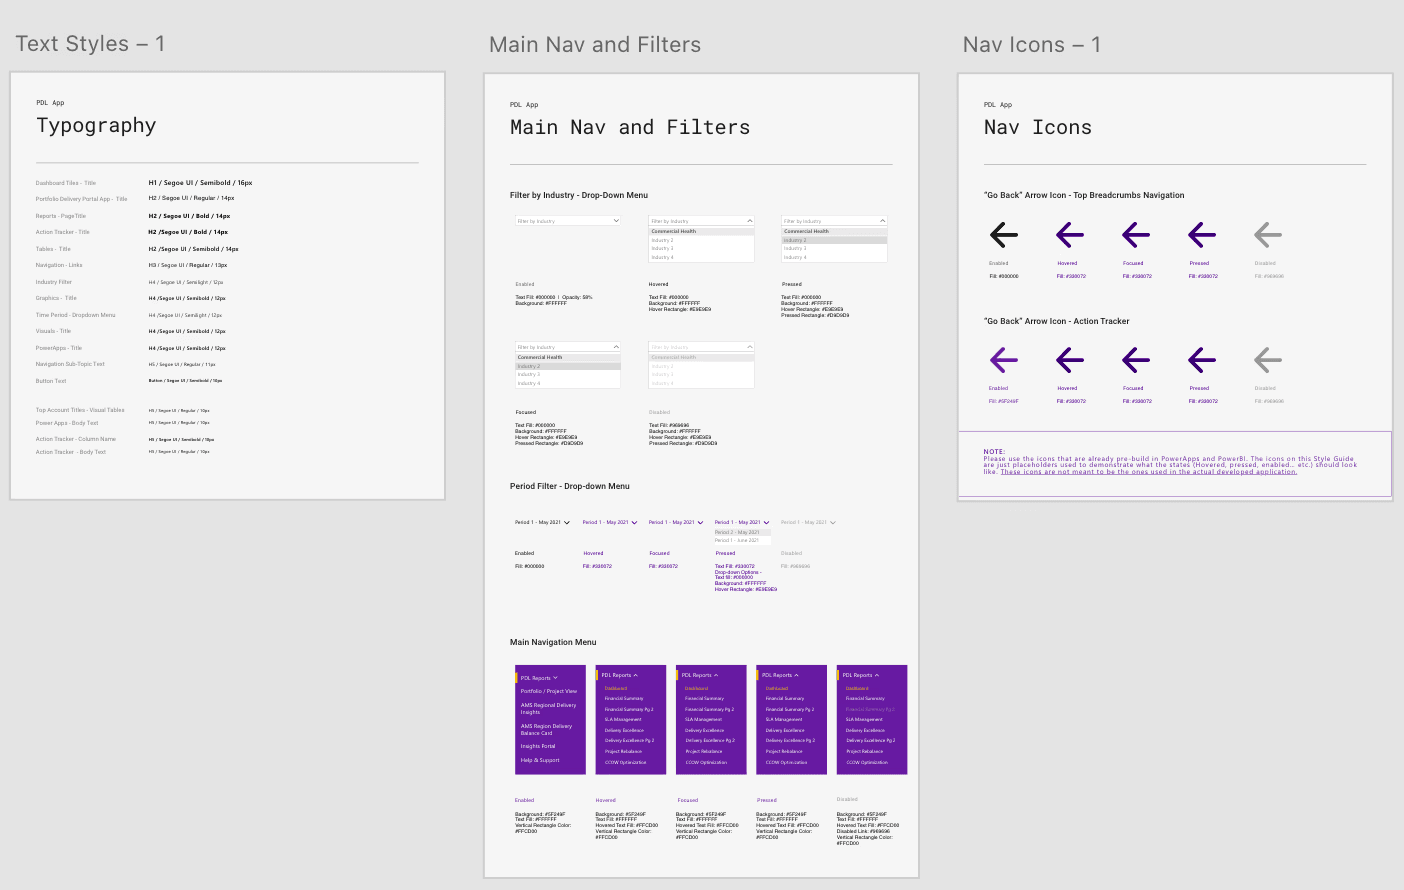
Visual Design & Style Guide: I developed a cohesive visual language, including color schemes, typography, and iconography, ensuring consistency throughout the app. I also created a style guide to maintain design consistency in future updates.

Lessons Learned
When it comes to data visualization, it is crucial to work closely with the target end-users to ensure that the graphics we build can be easily understood by them. Mocking up data reports together with the end-users during working sessions makes a huge difference in that regard!
“Merilly worked face-to-face with the client and the end users to ensure what they needed. She created documentation that I had never seen and that I am still in awe of. She was only brought in for 2 Sprints but she left behind her artist's touch that future developers on this project will unknowingly appreciate.”
Daniel Capps
Agile Coach and Scrum Master | DXC Technology